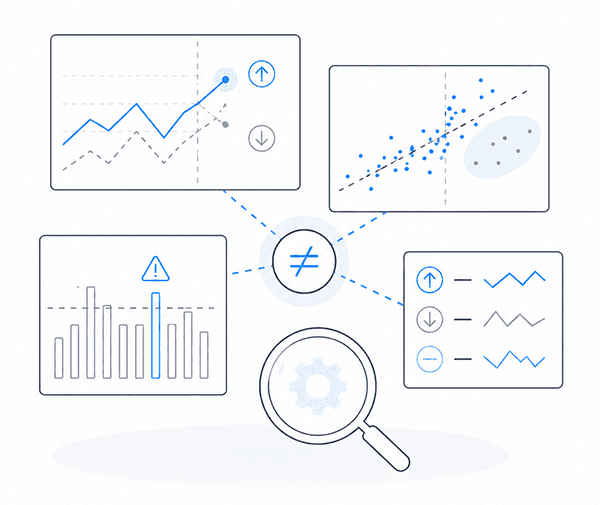
BG Gradient

DashSet for machine and production data

Put production data to work. Assess deviations faster.

DashSet brings machine data, sensor data, controller values, quality data and production context into one shared working environment. Teams spot deviations earlier, compare assets, lines and batches and prepare technical decisions in a traceable way – without replacing existing systems.

The situation

The industrial data is there. Technical decisions still take effort.

Production, machine building and engineering constantly generate data from machines, sensors, controllers, test benches and quality systems. What is often missing is the shared context: timelines, asset states, batches, orders, limits and quality data sit apart. Root cause analysis becomes slow, comparisons uncertain and decisions hard to trace.

Scattered data sources

Scattered data sources

Scattered data sources

Machines, sensors, controllers, files, databases and existing systems all deliver data, but rarely in one shared working context.

Machines, sensors, controllers, files, databases and existing systems all deliver data, but rarely in one shared working context.

Hard to compare

Hard to compare

Hard to compare

Assets, lines, batches, shifts or time periods are hard to compare when units, metadata and time references are inconsistent.

Assets, lines, batches, shifts or time periods are hard to compare when units, metadata and time references are inconsistent.

Manual analysis

Manual analysis

Manual analysis

Many analyses are done in Excel, scripts or isolated solutions. That costs time and makes technical traceability harder.

Many analyses are done in Excel, scripts or isolated solutions. That costs time and makes technical traceability harder.

DashSet pipeline

Put machine, process and quality data to work.

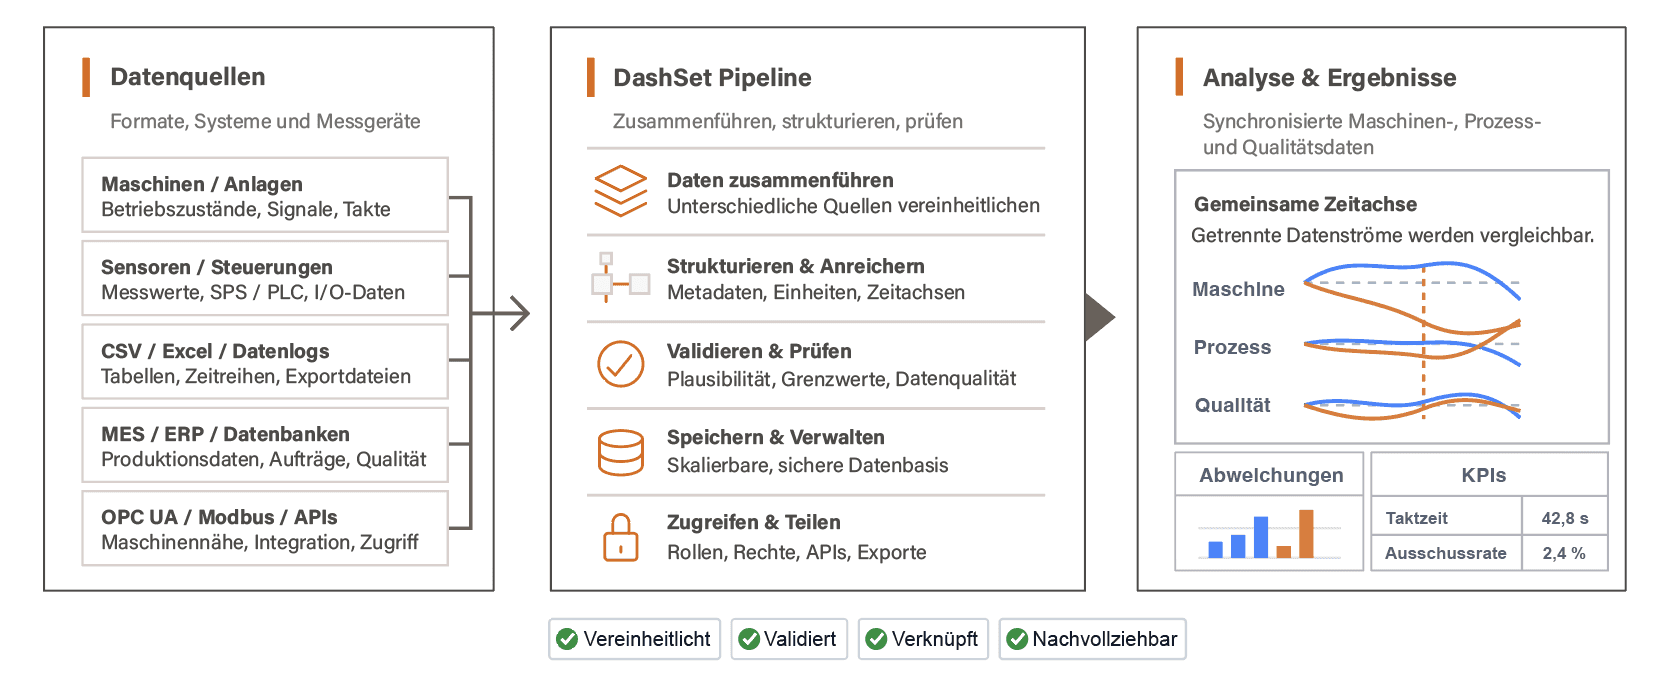
DashSet brings technical data from different sources together and prepares it for analysis, comparison and assessment. Existing systems are not replaced but connected and made usable step by step.

Connect data sources

Connect data sources

Connect data sources

Bring together machine, sensor, test bench, process and quality data from files, APIs, controllers, databases and existing systems.

Bring together machine, sensor, test bench, process and quality data from files, APIs, controllers, databases and existing systems.

Make data consistent

Make data consistent

Make data consistent

Structure timelines, units, metadata and asset context so technical data becomes comparable and reliably analyzable.

Structure timelines, units, metadata and asset context so technical data becomes comparable and reliably analyzable.

Prepare analyses

Prepare analyses

Prepare analyses

Make metrics, limits, deviations and trends visible as a basis for technical assessment.

Make metrics, limits, deviations and trends visible as a basis for technical assessment.

Unlock industrial data. Put analysis in DashSet to work.

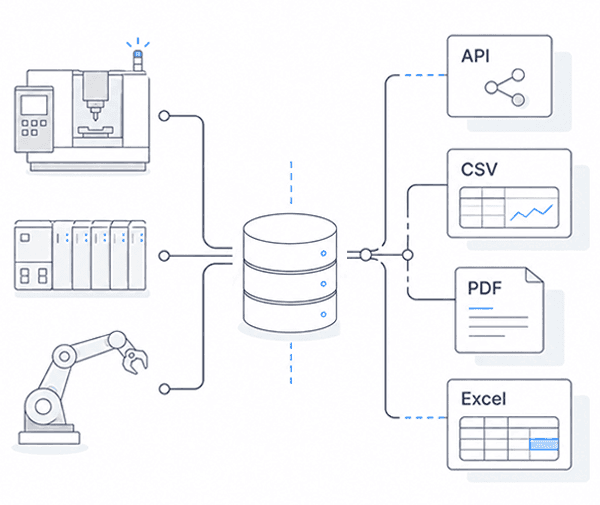
Xentara provides access to machine, controller and sensor data. DashSet brings this data into one shared analysis context, makes correlations visible and helps technical teams reach well-founded decisions faster.
Machine access with Xentara
Industrial systems, machines and controllers become data sources.

Data context in DashSet
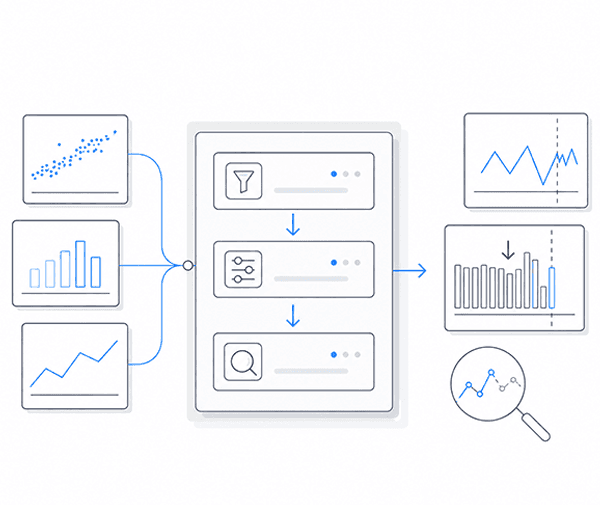
Connected data is structured, synchronized and linked with process, quality or test context.

Technical assessment
Deviations, patterns and correlations become visible for engineering or production teams to assess.

Typical use cases

Where DashSet makes a difference in industry and machine building.

Where DashSet makes a difference
in industry and machine building.

Where DashSet makes a difference in industry and machine building.

DashSet helps technical teams put machine, process and quality data to work on specific questions – from root cause analysis to continuous improvement of assets, processes and quality.
Machine and asset monitoring

View sensor values, operating states and process data together and spot developments early.
Analyze faults and downtime

Combine events, time series and machine states to narrow down causes faster.
Link quality with process data

Analyze test values, failure patterns and machine parameters together and reveal correlations.
Improve energy and resource efficiency

Compare consumption data with asset states, batches and process parameters.
Put brownfield data to work

Bring existing machines, files and systems into one shared data context step by step.

AI-assisted analysis

Assess technical data faster. Narrow down causes systematically.

Technische Daten
schneller bewerten. Narrow down causes systematically.

DashSet makes connected machine, process and quality data accessible for analysis and assessment. With AI support, patterns, deviations and correlations surface faster – as a basis for traceable technical decisions.

Spot anomalies faster

Spot anomalies faster

Surface deviations, limit violations and unusual patterns in machine, process or quality data faster.

Narrow down causes more precisely

View time series, machine states, batches and events together to better trace possible causes.

Narrow down causes more precisely

View time series, machine states, batches and events together to better trace possible causes.

Start comparisons more easily

Compare assets, lines, shifts or time periods and spot differences faster.

Start comparisons more easily

Compare assets, lines, shifts or time periods and spot differences faster.

Prepare traceable analyses

Prepare traceable analyses

Build filters, visualizations and analysis paths in a structured way and reuse them for later questions.

Pricing & budget

Your workspace. Your needs. Your budget.

Plan the DashSet workspace for your engineering or production team. Combine seats, devices and optional analysis features and get a first estimate of your monthly budget.

Machine and asset integration and project-specific services are agreed individually. The estimate is non-binding.

FAQ

on DashSet for industrial data

How is DashSet different from conventional production dashboards?

Does DashSet work in brownfield environments?

How does DashSet fit into existing system landscapes?

Which industrial data can DashSet work with?

Can DashSet start as a pilot project?

How does DashSet support technical decisions in production?

Intro call for DashSet

Find out whether DashSet fits your production and data environment

Find out whether DashSet fits your production and data environment

In 30 minutes, with no obligation, we talk about your machines, sensors, process data and quality questions. No preparation needed: we clarify first questions and assess together whether DashSet fits your situation. If it does, we agree on the next step.

What we cover in the intro call

Understand your situation

We talk about your machines, sensors, files, databases or systems and clarify where relevant data is created.

Discuss suitable applications

We take up your questions and show where DashSet could help first in your production – for example with process comparisons, quality analyses or deviation analyses.

Agree on the next step

If DashSet is a fit, we recommend a sensible entry point – for example a data context check or a first pilot project.

Understand your situation

We talk about your machines, sensors, files, databases or systems and clarify where relevant data is created.

Agree on the next step

If DashSet is a fit, we recommend a sensible entry point – for example a data context check or a first pilot project.

Discuss suitable applications

We take up your questions and show where DashSet could help first in your production – for example with process comparisons, quality analyses or deviation analyses.

Understand your situation

We talk about your machines, sensors, files, databases or systems and clarify where relevant data is created.

Discuss suitable applications

We take up your questions and show where DashSet could help first in your production – for example with process comparisons, quality analyses or deviation analyses.

Agree on the next step

If DashSet is a fit, we recommend a sensible entry point – for example a data context check or a first pilot project.

Have a question first?

Tell us briefly what it's about.
We will get back to you shortly.

Have a question?

Tell us briefly what it's about. We will get back to you shortly.