BG Gradient

DashSet for testing labs

Complex test data.
Clearly analyzed.

DashSet brings measurement, test bench and experimental data from different devices, files and analysis tools into one shared lab context. Test teams compare test runs faster, spot deviations earlier and prepare technical analyses in a traceable way.

The everyday lab challenge

Test data is created everywhere.
The context gets lost quickly.

In labs, measured values, test bench parameters, experimental data and reports are created in many places. When devices, files, timelines and analysis steps don't fit together, comparisons take effort and technical assessments are hard to trace.
Data is created in many places
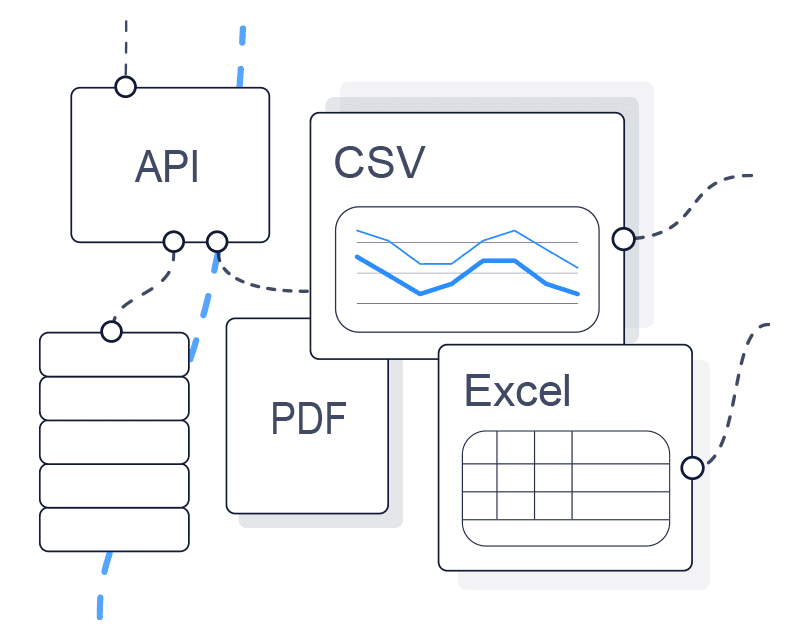
Measurement data, spreadsheets, reports and device exports often sit in different formats and systems.

Data is created in many places
Measurement data, spreadsheets, reports and device exports often sit in different formats and systems.

Data is created in many places
Measurement data, spreadsheets, reports and device exports often sit in different formats and systems.

Comparisons take time
Test runs have to be merged, adjusted and compared by hand.

Comparisons take time
Test runs have to be merged, adjusted and compared by hand.

Comparisons take time
Test runs have to be merged, adjusted and compared by hand.

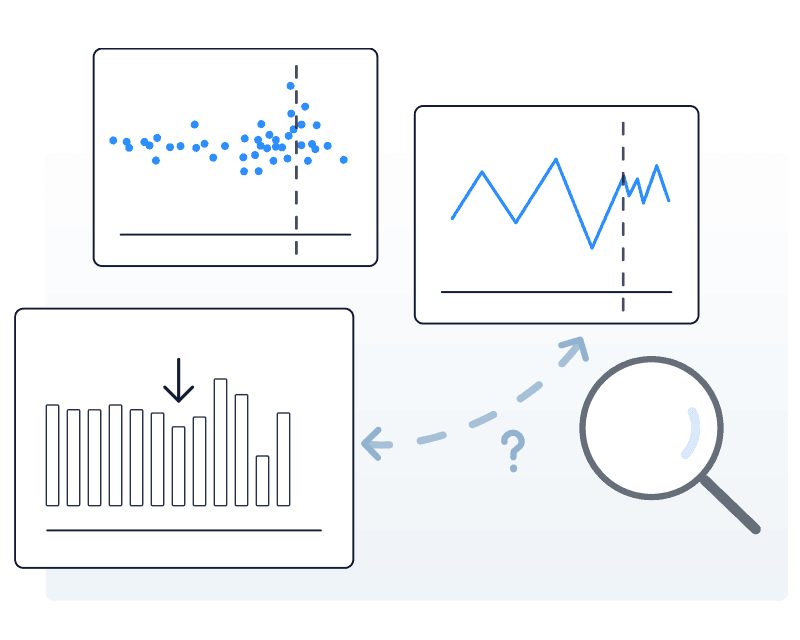
Correlations are hard to see
With scattered data, deviations, patterns and limits are often noticed late.

Correlations are hard to see
With scattered data, deviations, patterns and limits are often noticed late.

Correlations are hard to see
With scattered data, deviations, patterns and limits are often noticed late.

DashSet workflow

Scattered data becomes
one shared lab context.

DashSet connects lab devices, measurement systems, test bench and report data, structures raw data consistently and makes analyses comparable, traceable and reusable.

Connect data sources

Bring measurement files, sensor data, test bench data, spreadsheets, reports and interfaces into one shared data context.

Structure test data

Prepare measurement series, timelines, units and metadata consistently so data becomes comparable.

Build project context

Assign data, devices, measurement series and analysis steps to a clear project or test context.

Prepare analyses

Make key values, limits, deviations and trends visible and ready for technical assessment.

New: real time at the test station

Test sequences in real time.
Every DUT in view.

With Xentara, test profiles run in sync across climatic chamber, measurement system and device under test. DUT failures are detected the moment they occur and matched precisely to the chamber conditions.

Adoption without disruption

DashSet fits
your lab.
Not the other way around.

DashSet can start with individual devices, existing files or the analysis tools you already use. Proven processes stay in place and are brought step by step into one shared data and workflow context.

Start with existing data
CSV, Excel, device exports, reports or databases can serve as a first entry point.

Start with existing data
CSV, Excel, device exports, reports or databases can serve as a first entry point.

Start with existing data
CSV, Excel, device exports, reports or databases can serve as a first entry point.

Keep using existing tools
Spreadsheets, scripts and measurement software stay where they work. DashSet complements existing workflows.

Keep using existing tools
Spreadsheets, scripts and measurement software stay where they work. DashSet complements existing workflows.

Keep using existing tools
Spreadsheets, scripts and measurement software stay where they work. DashSet complements existing workflows.

Expand step by step
Start with one specific test process, then extend to more devices, sources, teams and recurring analyses.

Expand step by step
Start with one specific test process, then extend to more devices, sources, teams and recurring analyses.

Expand step by step
Start with one specific test process, then extend to more devices, sources, teams and recurring analyses.

Tangible benefits

Tangible benefits

Less effort.
Better decisions.

Less effort.
Better decisions.

DashSet reduces manual data work, makes test runs easier to compare and creates a traceable basis for technical assessments.
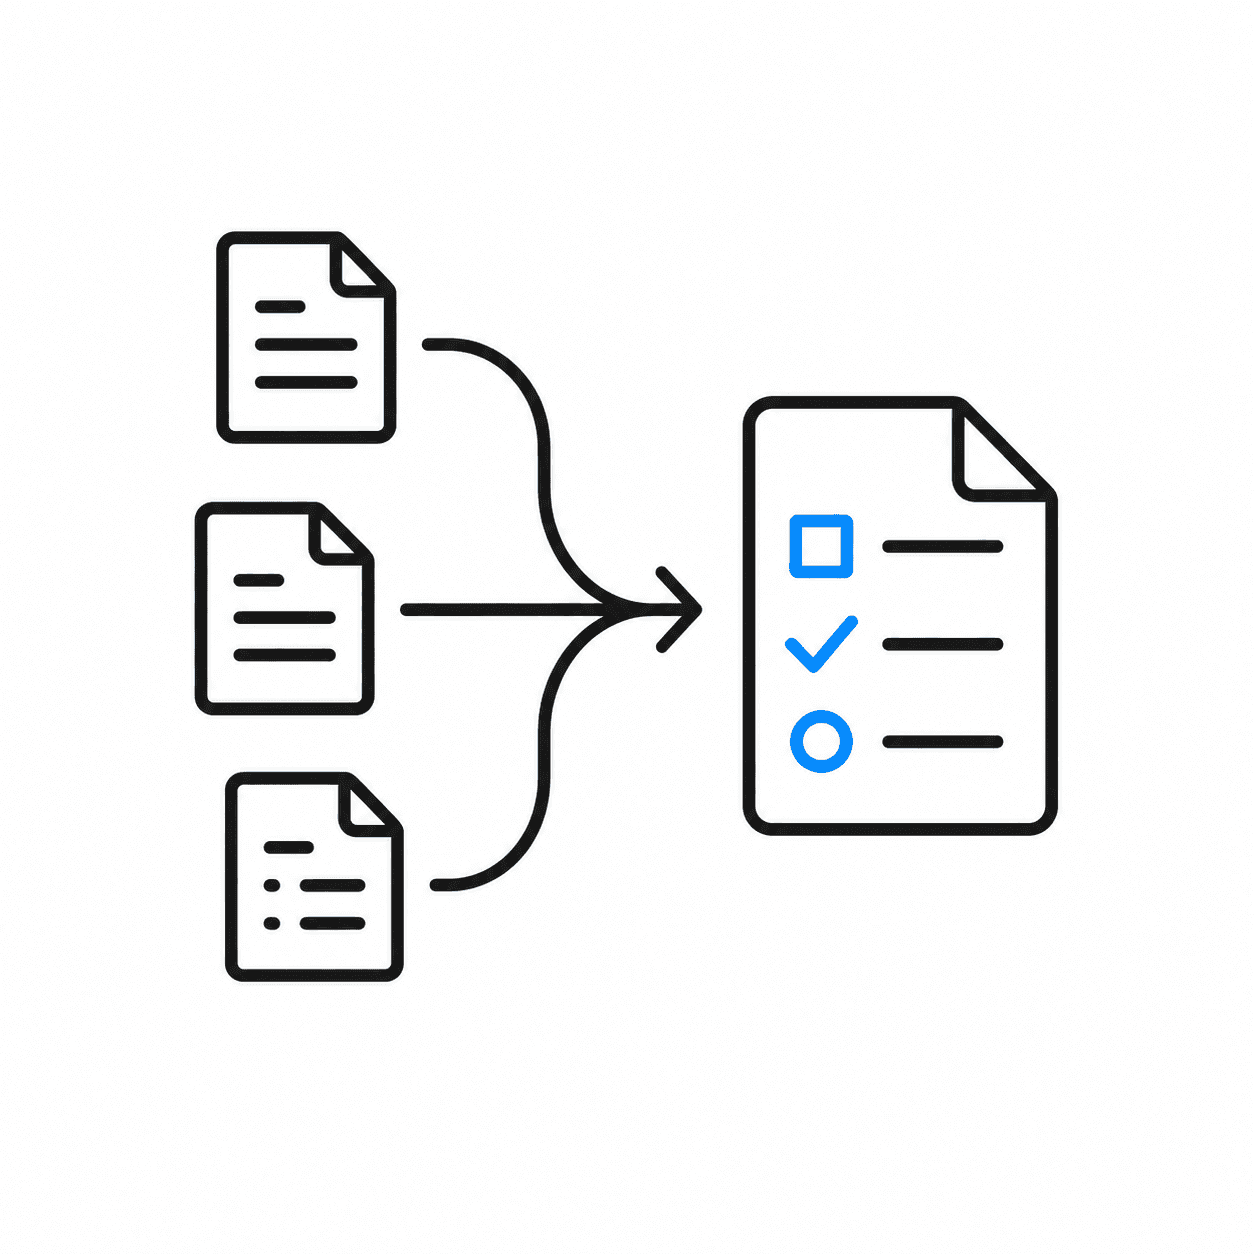
Less manual preparation
Test data no longer has to be gathered and adjusted for every analysis.

Test data no longer has to be gathered and adjusted for every analysis.

Compare test runs better

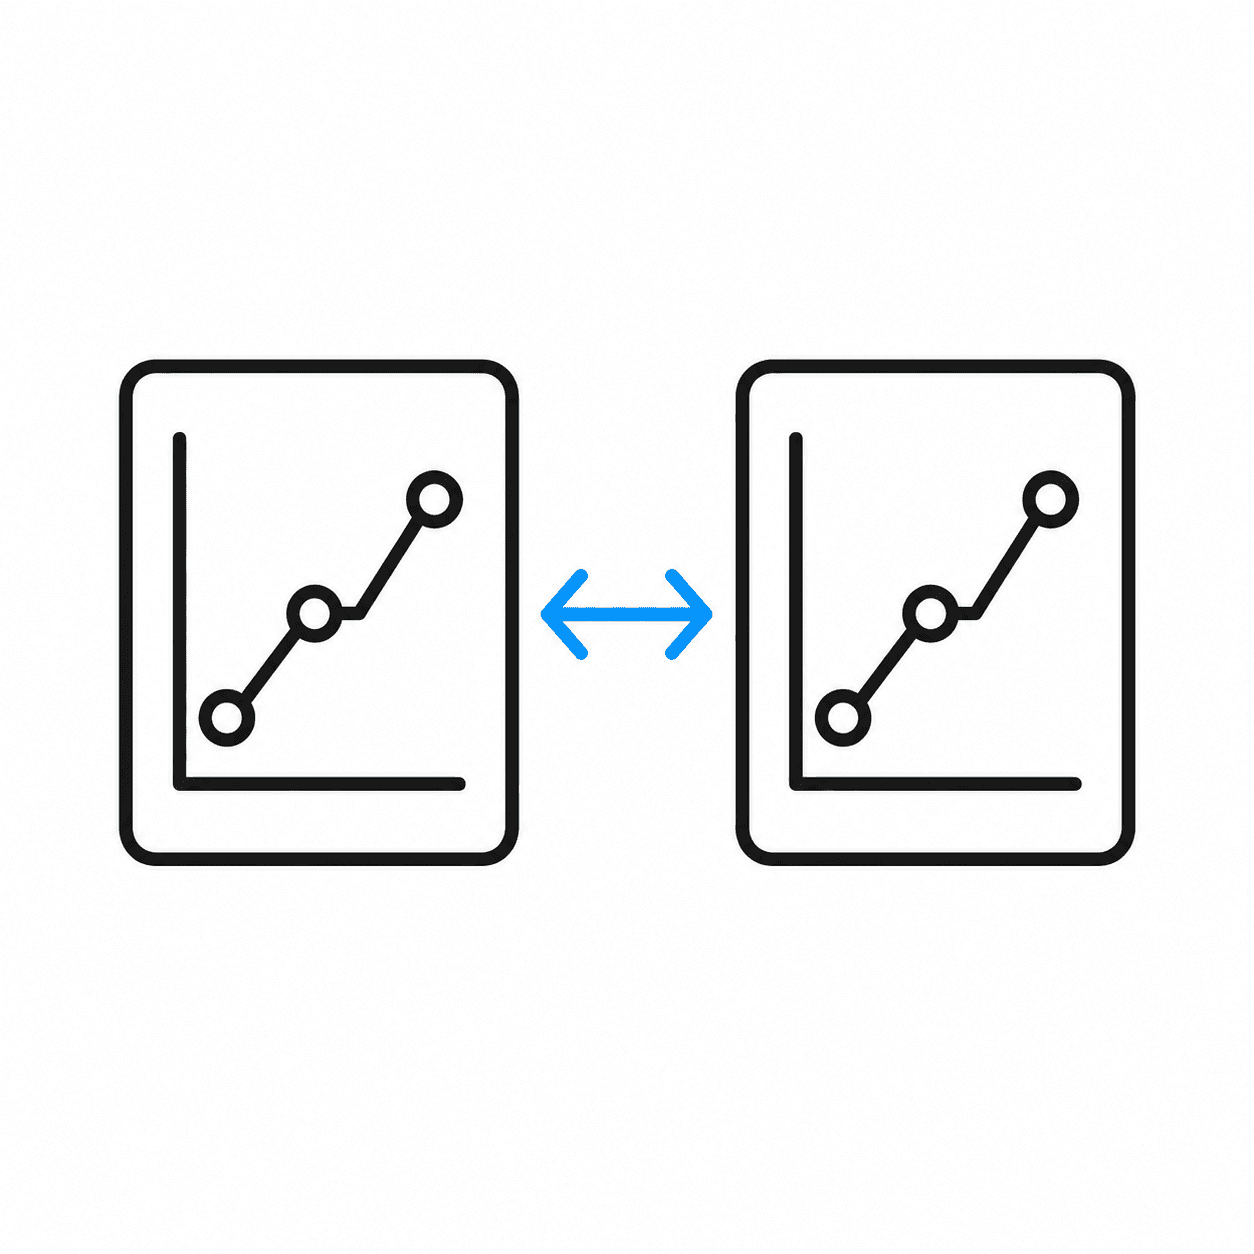
Measurement series, parameters and test variants can be compared across multiple tests.
Stay technically traceable

Data sources, preparation steps and results stay transparent and verifiable.
See anomalies earlier
Deviations, limits and recurring patterns become visible faster.

Deviations, limits and recurring patterns become visible faster.

Ready for AI and scalable analysis

Structured test data and traceable workflows lay the foundation for AI-assisted analysis, automation and compute-intensive analyses.

Pricing & budget

What does DashSet cost for your lab?

Configure your workspace to fit your lab team: with devices, seats and optional cloud and AI features. The configurator shows your monthly budget and matching sample calculations.

One-time device integration is agreed separately. The estimate is non-binding.

FAQ

on DashSet for lab measurement data

How is DashSet different from conventional lab dashboards?

Does DashSet replace a LIMS or existing lab software?

Which labs is DashSet suited for?

Can we start with a single device or use case?

What role does AI play in measurement data and analysis?

How are measurement data and lab information protected?

Intro call for DashSet

Is DashSet right
for your lab?

In 30 minutes, with no obligation, we talk about your measurement data, devices, interfaces and test sequences. No preparation needed. Together we check whether DashSet fits your lab and what a sensible next step would be.

What we cover in the intro call

Understand your situation

We talk about your measuring devices, interfaces, files or databases and clarify where relevant data is created.

Find the right starting point

We identify a specific test process, dataset or work step where DashSet could start.

Agree on the next step

If DashSet is a fit, we recommend a sensible entry point – for example a data context check or a first pilot project.

Understand your situation

We talk about your measuring devices, interfaces, files or databases and clarify where relevant data is created.

Agree on the next step

If DashSet is a fit, we recommend a sensible entry point – for example a data context check or a first pilot project.

Find the right starting point

We identify a specific test process, dataset or work step where DashSet could start.

Understand your situation

We talk about your measuring devices, interfaces, files or databases and clarify where relevant data is created.

Find the right starting point

We identify a specific test process, dataset or work step where DashSet could start.

Agree on the next step

If DashSet is a fit, we recommend a sensible entry point – for example a data context check or a first pilot project.

Have a question first?

Tell us briefly what it's about.
We will get back to you shortly.

Have a question?

Tell us briefly what it's about. We will get back to you shortly.